The Contributions Dashboard provides a quick snapshot of your Contributions data. This includes information about the number of contributors you have in different categories, and information on Weekly, Monthly and Yearly giving.
The Church Dashboard for Contributions contains tabs for four different views. Contributors, Weekly giving, Monthly giving, and Yearly giving
Contributors
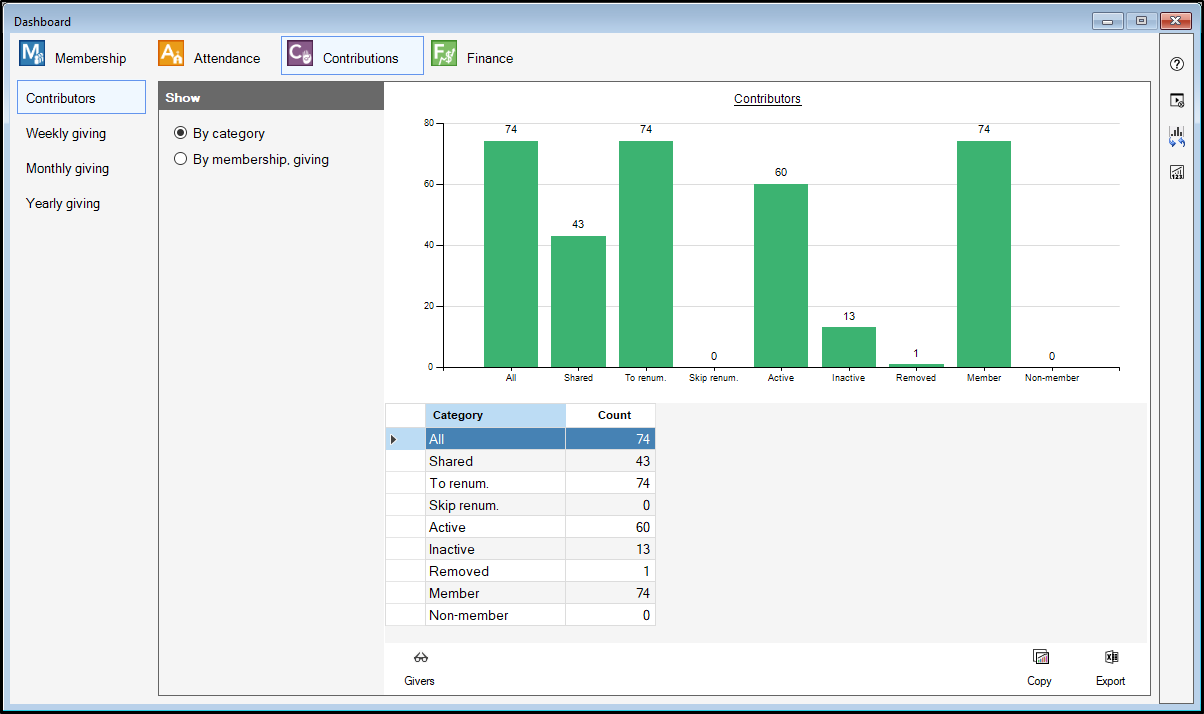
The Contributors view of the Dashboard will provide you with counts of your Contributors in different categories and giving totals for different categories of members. This is broken up into two different options:
- By category - This view will show you the counts of your givers in different categories, such as Shared envelopes, To be renumbered, to be skipped, Active, Inactive, as well as a few others. To see who is in a particular category, click on the category you want to look into, and click the "Givers" button at the bottom left of the window.
- By Membership, giving - This view will show you your giving for each year, split up into 4 columns. Total, Member, Non-member, Loose/plate.
Weekly giving
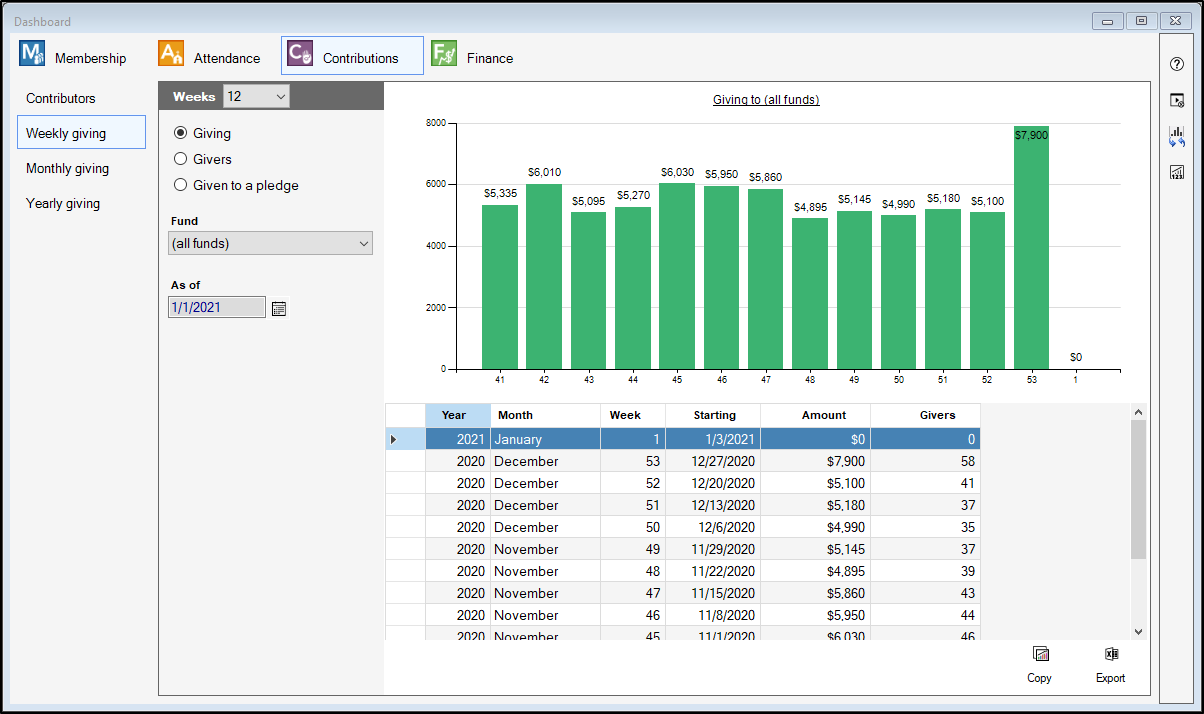
The Weekly giving view of the dashboard will show you either giving totals, number of givers, or amount of pledged giving over a number of weeks to all or one particular fund starting from the date of your choice. You can view 12, 18, 24, or 30 weeks of giving at once.
- Giving - This view will show you a graph with weekly giving totals for each week in the time period you set. The chart below the graph at the top of the page will show you the Year, Month, Week, what date that week started, the giving total, and the number of givers for that week.
- Givers - This view will show you a graph with the number of givers for each week in the time period you set. The chart below the graph at the top of the page will show you the Year, Month, Week, what date that week started, the giving total, and the number of givers for that week.
- Given to a pledge - This view will show you a graph with weekly giving totals that have been given towards a pledge. The chart below the graph at the top of the page will show you the Year, Month, Week, what date that week started, the giving total, and the number of givers for that week.
Monthly giving
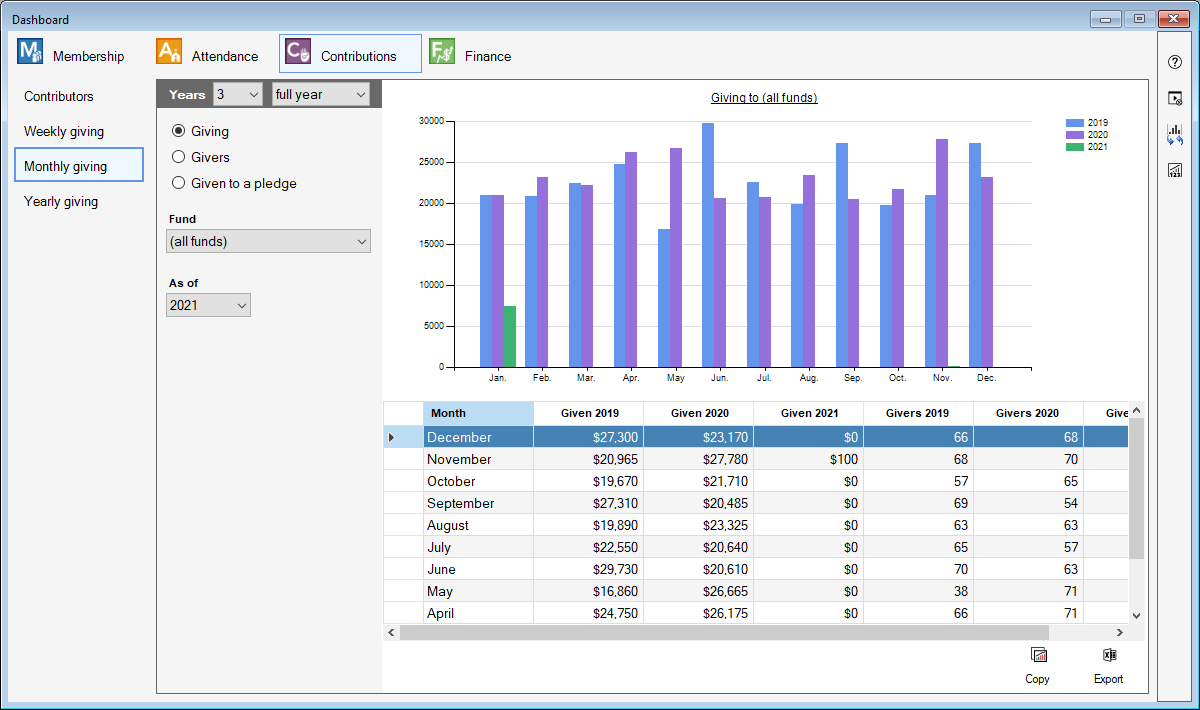
The Monthly giving view of the dashboard will show you either giving totals, number of givers, or amount of pledged giving over multiple years, broken out by month. You can look at full years, or particular segments of years, such as each quarter or half years. You can look at all funds, or one particular fund, and you can also set which year you're looking back from.
- Giving - This view will show you a graph with monthly giving totals for each year in the time period you set. The chart below the graph at the top of the page will show you the giving totals for each year in the time period, and the number of givers for each year in the time period.
- Givers - This view will show you a graph with monthly totals for the number of givers you had for each year in the time period you set. The chart below the graph at the top of the page will show you the giving totals for each year in the time period, and the number of givers for each year in the time period.
- Given to a pledge - This view will show you a graph with monthly pledged giving totals for each year in the time period you set. The chart below the graph at the top of the page will show you the pledged giving totals for each year in the time period, and the number of pledged givers for each year in the time period.
Yearly Giving
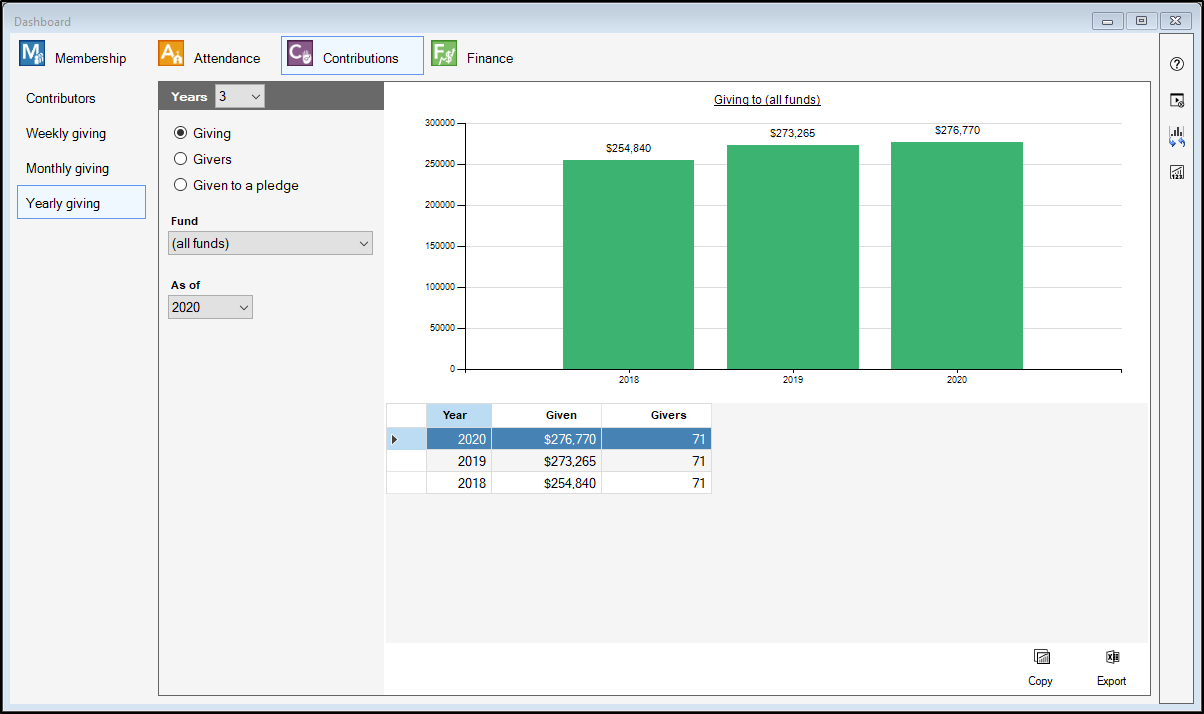
The Yearly giving view of the dashboard will show you either giving totals, number of givers, or amount of pledged giving over multiple years, with yearly totals. You can look at these totals for all funds or just a single fund, and you can also set which year you're looking back from.
- Giving - This view will show you a graph with yearly giving totals for each year in the time period you set. The chart below the graph at the top of the page will show you the giving totals for each year in the time period, and the number of givers for each year in the time period.
- Givers - This view will show you a graph with yearly totals for the number of givers you had for each year in the time period you set. The chart below the graph at the top of the page will show you the giving totals for each year in the time period, and the number of givers for each year in the time period.
- Given to a pledge - This view will show you a graph with yearly pledged giving totals for each year in the time period you set. The chart below the graph at the top of the page will show you the pledged giving totals for each year in the time period, and the number of pledged givers for each year in the time period.